
A campaign is about to launch, a checkout flow is being rewritten, or a mobile app team needs to validate API behavior across regions. The traffic model is clear enough. The tooling decision usually isn't. You can pick a code-first framework, a GUI-led recorder, an open-source workhorse, or a managed platform that hides most of the infrastructure. Each choice changes how quickly you can build tests, how easily you can maintain them, and how much operational drag you inherit later.
Load testing is simulated demand used to assess response times, throughput, error behavior, and overall system stability under concurrent use. In practice, good load tests answer very practical questions. Will authentication collapse under peak logins? Will rate limiting behave correctly? Will a regional checkout flow slow down when a campaign sends users from multiple countries at once?
The right comparison points are straightforward. Look at the scripting model, protocol support, distributed execution options, reporting quality, pricing approach, maintenance burden, and whether the tool can support responsible geo-testing when location matters.
That last point gets confused often. Mobile, residential, and datacenter proxies solve different origin-IP and location-testing problems. They are not load generators, and they are not browser simulators. Use them only when the application flow depends on geography, ASN, or network identity. If you're just validating API capacity, they often add noise you don't need.
1. Apache JMeter
Apache JMeter remains the default answer when a team needs broad protocol coverage without license friction. Apache describes it as a 100% pure Java application designed to load test functional behavior and measure performance, which explains why it still fits protocol-heavy backends and reusable CI jobs well. It's especially useful when one team has to test APIs, databases, queues, and older service patterns from one place.

A common pattern is a QA team validating account registration, password reset, and session handling before a launch. Another is an affiliate or growth team pressure-testing a landing page API path before paid traffic spikes. JMeter works well here because you can start small, reuse test elements, and layer in assertions without rebuilding the whole test harness.
Where JMeter fits best
JMeter is strongest when the test surface is wider than simple HTTP.
- Multi-protocol validation: It suits teams testing web endpoints, JDBC-backed flows, or service integrations in one project.
- Scriptable repeatability: CLI execution makes it easy to run scheduled checks in CI/CD after the test plan is stable.
- Low entry cost: Open source matters when a team needs many repeat runs and doesn't want procurement involved.
Practical rule: Start with a baseline and ramp gradually. Sudden spikes are useful for stress testing, but they're a bad first pass for understanding normal behavior.
It also helps to separate target latency from network path issues. Before blaming the app, check the route, DNS behavior, and proxy path if you're using one. A simple proxy speed test workflow is often enough to catch test-environment noise before it pollutes your results.
JMeter's downside is maintenance. Correlation can get messy when tokens, dynamic IDs, and chained state are everywhere. It's still one of the most practical load testing tools, but it rewards teams that treat test plans like assets, not disposable scripts.
2. Gatling
Gatling is a better fit when developers want load tests to behave like application code. You define scenarios in code, commit them to version control, review changes in pull requests, and run them in pipelines. That workflow matters when performance tests need to evolve with the service instead of being owned by a separate QA island.
For SaaS onboarding, checkout journeys, or ad verification APIs with conditional logic, Gatling usually feels cleaner than a GUI-driven tool. Multi-step flows are easier to read when each request, pause, feeder, and assertion sits in code next to the rest of the scenario. Teams that care about realistic pacing also benefit from explicit think times and branching logic.
What Gatling gets right
The biggest advantage is maintainability under change. If your auth flow changes every sprint, code usually ages better than recorded scripts.
- Scenario readability: Feeders, chained requests, and assertions make business-critical paths easier to model.
- Developer workflow: Test code lives in Git, so performance checks can move with release branches.
- Stakeholder reporting: Gatling's reports are usually easier to share with non-specialists than raw logs or CSV exports.
A practical use case is regional ad delivery validation. An ad verification team may need to simulate impression tracking, landing redirects, and callback logging while preserving session logic. Gatling can model that well, but the geo-layer should stay separate from the load model. Add proxy rotation only if regional response behavior is part of the test objective.
The trade-off is obvious. Gatling is less friendly for teams that want point-and-click authoring, and it's not the first choice when protocol diversity matters more than developer ergonomics. But for code-first API and web workflows, it's one of the cleaner options.
3. LoadRunner
LoadRunner sits in the category of tools you choose because the system under test is complicated, not because the setup is lightweight. It's usually brought in when a company needs recording, replay, analytics, and deeper enterprise diagnostics in one platform. That often applies to financial systems, telecom authentication flows, and large retail stacks with a lot of moving parts.
The appeal is breadth. When scripts need correlation, parameterization, transaction handling, and coordinated monitoring across app and infrastructure layers, LoadRunner can support a disciplined performance practice. Teams often use it for systems where a failed test has direct business cost, such as payment orchestration or high-volume login windows.
When LoadRunner earns its complexity
This tool makes more sense when the environment itself is expensive and politically sensitive. In that setting, more control and more analytics can be worth the setup overhead.
- Recorded workflows: Useful for teams that need to capture interactions and refine them rather than hand-code everything.
- Correlation-heavy applications: Better suited to flows with dynamic tokens, session state, and brittle replay behavior.
- Enterprise observability alignment: Stronger when performance engineers need to line up load events with server-side telemetry.
The best LoadRunner projects don't chase maximum virtual users first. They lock down realistic transactions, dynamic value handling, and monitoring coverage before scaling.
For geo-dependent validation, the same warning applies as with any enterprise platform. Don't use proxies just because the product page says “global.” Use them when region, carrier path, or IP identity changes application behavior. Otherwise, they can blur whether you're testing the app or the network around it.
4. Locust
Locust is what many Python teams reach for when they want speed, flexibility, and very little ceremony. You write user behavior in Python, run it locally or in distributed mode, and iterate fast. That simplicity is why it works well for startups, internal platform teams, and API-heavy services where developers already live in Python.
A social media management platform is a good example. If the team needs to test concurrent login handling, session refresh, task polling, and webhook callbacks, Locust can express that logic without much framework overhead. The same goes for market research pipelines or click-tracking services that need repeated regression checks in CI.
Why Python teams like Locust
Locust tends to win on familiarity, not feature bloat.
- Pure Python test code: No separate DSL to learn.
- Fast iteration: It's easy to swap in test data, custom auth logic, or helper libraries.
- Distributed runs: Horizontal scaling is straightforward once the scenarios are stable.
A practical pattern is to model classes of users instead of one generic flood of requests. One user type may log in and read data. Another may create records. A third may poll status endpoints. That gives you a more realistic traffic mix than hammering one endpoint because it's easy.
Locust also plays well with origin-IP testing when needed. If a team is checking regional rate limiting or geo-locked responses, mobile 4G proxies can be added at the request layer. Just keep the purpose narrow. Locust should still be measuring application behavior, not serving as a vague “browser replacement.”
Its weakest point is out-of-the-box protocol breadth. If your team needs many non-HTTP workflows without building adapters, another tool will usually get you there faster.
5. K6
K6 is one of the cleanest fits for DevOps-heavy teams that want performance testing to run like any other automated check. Tests are written in JavaScript and executed by a Go-based engine, which makes the authoring model accessible to many web and platform engineers. If the goal is “run this on every commit, fail the build on threshold breaches,” K6 is usually near the top of the shortlist.

It works especially well for API contracts that need both correctness and performance gates. A marketing automation platform, for example, might validate tracking pixel calls, event ingestion, and callback APIs before every deployment. K6 keeps that close to normal engineering workflows.
Where K6 is strongest
K6 shines when test code, CI, and observability all need to line up.
- JavaScript scripting: Familiar for teams already building frontend or Node-based services.
- Threshold-driven automation: Useful when release decisions depend on clear pass or fail conditions.
- Cloud and local execution options: Good for teams that start small and expand later.
One independent market estimate projects the performance testing tools segment at USD 1.87 billion in 2026 and USD 3.59 billion by 2031, with a 13.97% CAGR. Another estimate in that same source places the broader market at USD 1.6 billion in 2024 and projects USD 17.0 billion by 2034, with load testing representing 45.2% of the testing-type segment. In practical terms, tools like K6 fit the broader shift toward continuous validation inside DevOps, not occasional benchmark exercises.
K6 is less attractive when you need broad legacy protocol support. It's also not where I'd start with a non-technical QA team that wants visual authoring. But for modern API workflows, it's efficient and easy to operationalize.
6. Neoload
Neoload is the kind of tool teams choose when they want enterprise features without pushing everyone into code-first authoring. It's often a better fit for mixed teams where QA, performance engineering, and platform operations all need visibility into the same tests. Recording workflows and analyzing regressions can be faster when the tooling does more of the setup work for you.
That matters in places like digital banking onboarding, streaming platform release validation, or travel booking engines with lots of state and third-party calls. In those environments, a test script that survives change is more valuable than a script that looked elegant on day one.
Best use for Neoload
Neoload tends to work best when protocol depth and diagnostics matter more than open-source flexibility.
- Workflow capture: Useful for multi-step journeys with dynamic session data.
- Cross-team usability: Easier to spread across QA and engineering than some code-only tools.
- Regression analysis: Better suited to repeated test cycles than one-off benchmark runs.
A lot of teams underestimate the difference between stress testing once and scaling a repeatable performance practice. That's where a disciplined approach to scalability testing methods helps. You need planned load steps, clear pass conditions, and enough observability to know whether failures came from code, infrastructure, or the dependency chain.
Neoload isn't the leanest option for a startup validating a simple REST API. But if you're testing broad user journeys, packaged applications, or infrastructure-sensitive systems, it can save time that would otherwise disappear into script repair and result interpretation.
7. Artillery
Artillery is a practical option for Node.js teams and API programs that want something lighter than a heavyweight enterprise suite. YAML scenarios make simple tests quick to write, and JavaScript hooks add flexibility when a flow needs dynamic values, custom setup, or response validation. That combination is useful for feature branches, service-level checks, and repeated performance gates in CI.
A martech platform is a good fit. One team might validate impression logging and event ingestion on every branch. Another might exercise a regional signup API before a campaign rollout. Artillery keeps that work close to the existing JavaScript stack.
Why teams choose Artillery
Artillery is less about broad protocol ambition and more about workflow speed.
- YAML for common scenarios: Good for getting useful tests running quickly.
- JavaScript extensibility: Helpful when simple request chains become stateful flows.
- Microservice orientation: Works well for HTTP-centric systems that change often.
"Keep the test script simpler than the service you're testing." If your Artillery scenario starts recreating your entire application state machine, the test will become the maintenance problem.
When location matters, route decisions should stay explicit. If you're checking how a campaign lands from different regions, or whether an edge rule behaves differently by origin, a load-balancing proxy setup can help structure traffic paths. But that still doesn't replace true distributed load generation. It only changes where requests appear to come from.
Artillery isn't the best answer for deep enterprise protocol needs. For fast-moving HTTP services, though, it's easy to justify.
8. BlazeMeter
BlazeMeter appeals to teams that want distributed execution without running and maintaining all the infrastructure themselves. It's especially attractive when a company already has script assets and needs a managed way to run them from multiple regions, collect results, and share them across teams.
That model fits e-commerce launches, fintech release validation, and ad-network capacity checks where the team wants scale but doesn't want to spend its time operating load generators. Managed execution can also reduce internal friction because the test environment becomes easier to standardize.
Managed execution without building the grid
BlazeMeter is useful when infrastructure management is the part your team wants to avoid.
- Cloud-based scale: Better for organizations that don't want to maintain distributed generators.
- Shared reporting: Easier to socialize results across engineering, QA, and operations.
- Script portability: Helpful for teams extending existing performance practices instead of starting over.
A second practical issue is cost shape. Independent 2026 coverage notes that Grafana Cloud offers a 500 VUh free allowance, while Locust and JMeter remain free at any scale. That same source says the market is projected to grow from $2.8 billion in 2025 to $7.1 billion by 2034 at a 10.9% CAGR, and describes SME demand as the fastest-growing segment. The lesson isn't free versus paid. It's that repeat execution, generator infrastructure, scripting time, and integration overhead should all be priced as one system.
BlazeMeter makes sense when managed distribution is the bottleneck. If your real problem is weak test design or poor observability, a cloud control plane won't fix that.
9. WebLOAD
WebLOAD has one of the clearer historical through-lines in this category. It was first launched in August 1997, and its documented version history includes more than 20 releases, with milestones such as cloud load testing in 2012, mobile support and IPv6 in 2013, Jenkins integration in 2013, and WebSockets testing in 2014, as summarized in WebLOAD's documented history. That timeline matters because it shows how load testing tools evolved from simple HTTP stress checks into broader platforms tied to cloud, CI/CD, mobile, and modern protocols.
For practitioners, WebLOAD is interesting when the environment mixes browser-like workflows, APIs, and broad enterprise delivery needs. Retail checkouts, patient portals, and online banking flows often fall into that category because the tests need both script flexibility and a lot of diagnostic context.
Why WebLOAD still matters
Long-lived tools survive because they solve script maintenance and team workflow problems, not because they have the flashiest UI.
- Hybrid operating model: Useful for teams that need an IDE and cloud execution options.
- Complex journey support: Better suited to AJAX-heavy or stateful application paths.
- Operational maturity: Integrations like CI support matter more than marketing once tests become routine.
One practical note. WebLOAD is often best when a performance team wants more structure than open-source frameworks typically provide, but doesn't want to hand-build every part of the test environment. It's less compelling for a small team with one API and a strong code-first culture.
10. Taurus
Taurus is less a load engine than a unifying layer. That's what makes it valuable. If one team uses JMeter, another uses Locust, and a third wants to standardize CI execution without forcing a rewrite, Taurus can smooth that out through YAML-driven configuration and result handling.
That's useful in enterprises, but also in smaller organizations where tool sprawl happened naturally. A growth team may have one legacy JMeter suite for campaign endpoints, while a backend team runs Python-based checks elsewhere. Taurus gives both groups a way to converge operationally before they converge technically.
Where Taurus makes sense
Taurus is a practical choice when standardization is more urgent than replacement.
- Unified execution layer: Helpful for organizations with multiple engines in active use.
- Simpler onboarding: New contributors can start with YAML instead of learning every native syntax at once.
- Migration support: Useful when teams are comparing engines or gradually shifting ownership.
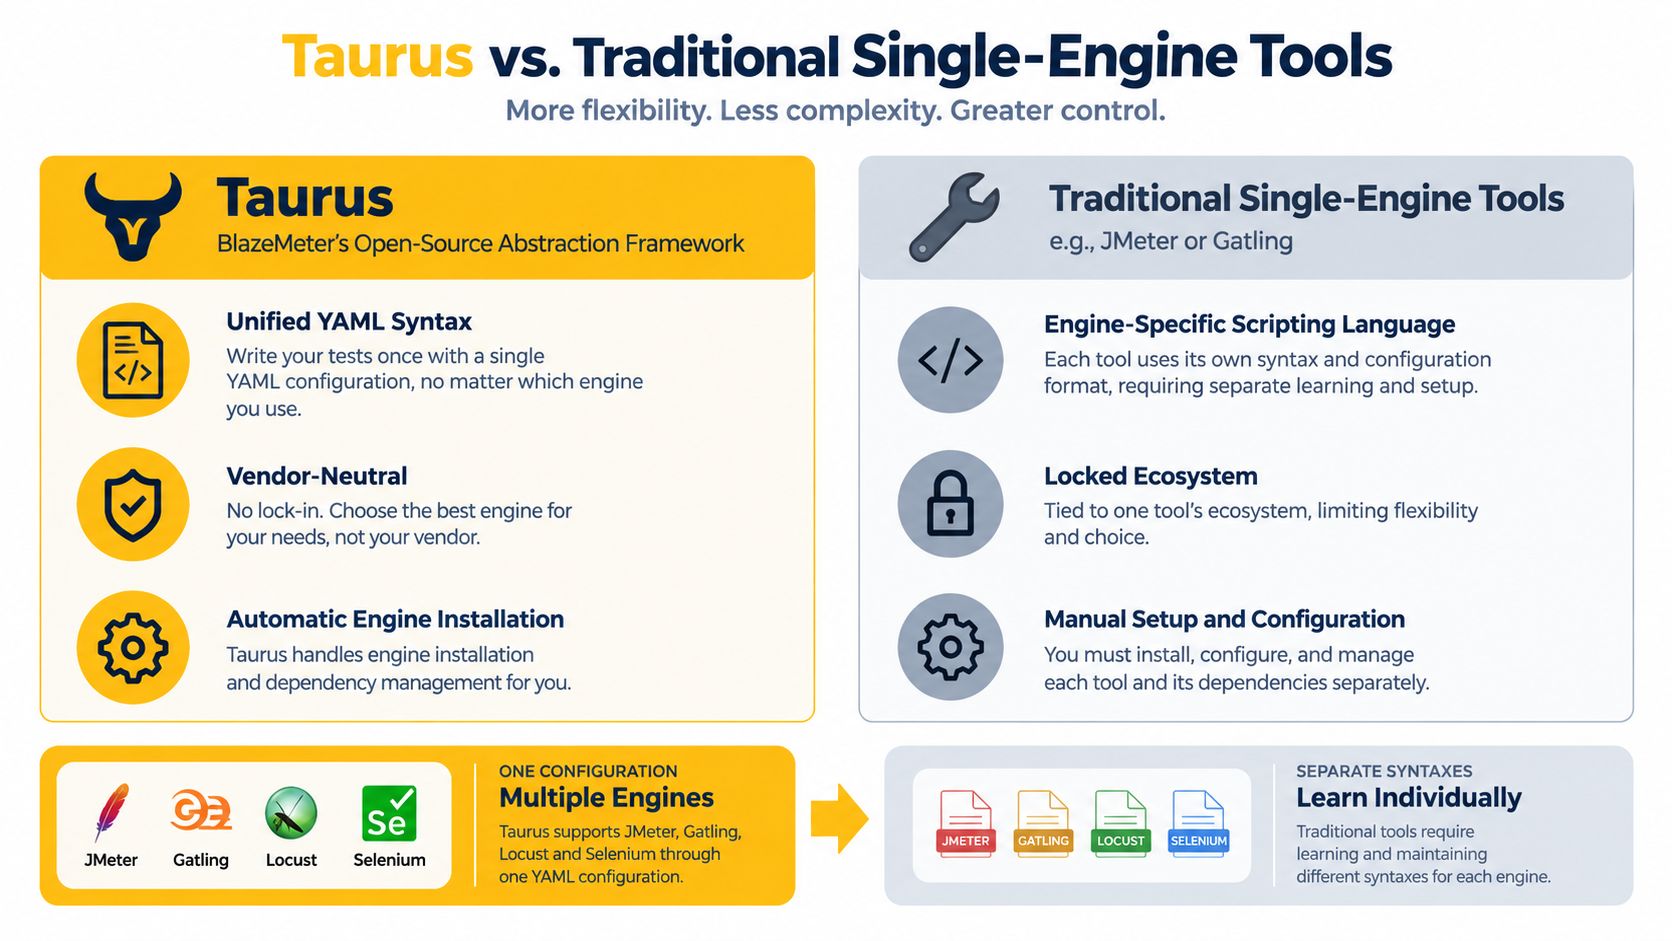
One market signal supports why abstraction layers matter. Independent adoption data indicates that more than 9,200 companies use performance and load testing tools, and JMeter alone accounts for about 56.30% of that tracked market, with 5,180 customers, according to the adoption summary cited in this market review. In plain terms, many teams already have JMeter somewhere. Taurus helps when the goal is to organize that reality instead of pretending everyone will switch at once.
It's not a cure-all. If the underlying scripts are weak, Taurus won't make them strong. But it can make mixed-tool environments much easier to operate.
Top 10 Load Testing Tools Comparison
| Tool | Core features | UX / Quality (★) | Price (💰) | Target (👥) | Unique selling points (✨ / 🏆) |
|---|---|---|---|---|---|
| Apache JMeter | Multi-protocol samplers (HTTP, FTP, JDBC, SOAP); distributed testing; plugins | ★★★★, mature reporting; steeper learning curve | 💰 Free, open-source | 👥 QA teams, enterprises, testers needing protocol breadth | ✨ Wide protocol support & plugin ecosystem; 🏆 large community |
| Gatling | Scala DSL, realistic user pacing, efficient single-machine load | ★★★★, code-first, great for devs; harder for non-programmers | 💰 OSS free; Enterprise paid | 👥 Dev teams, CI/CD, performance engineers | ✨ Code-as-tests for reproducible scenarios; high efficiency |
| LoadRunner | VuGen recording, 50+ protocols, server-side monitoring & tracing | ★★★★★, enterprise diagnostics; complex UI | 💰 Premium enterprise licensing | 👥 Large enterprises (finance, telecom) | ✨ Deep root-cause analysis & protocol coverage; 🏆 enterprise-grade |
| Locust | Python-based scenarios, web UI, distributed workers | ★★★★, very easy for Python users; fast iteration | 💰 Free, open-source | 👥 Startups, Python teams, agile testers | ✨ Simple Python scripting + real-time web control |
| K6 | JavaScript tests, Go engine, local/cloud scaling, thresholds | ★★★★, DevOps-friendly, smooth CI integration | 💰 Free OSS + paid cloud tiers | 👥 DevOps, JS developers, CI pipelines | ✨ JS-native tests with cloud scaling & streaming metrics |
| Neoload | AI-assisted test design, ML anomaly detection, rich integrations | ★★★★★, AI insights; powerful but complex | 💰 Premium / enterprise | 👥 Large enterprises, mobile & complex systems | ✨ AI-driven correlation & optimization; 🏆 advanced analysis |
| Artillery | YAML/JS test definitions, WebSocket/SSE support, low overhead | ★★★, quick to start; less feature-rich for enterprises | 💰 Free OSS; paid options | 👥 Startups, Node.js teams, API-focused testers | ✨ YAML-first simplicity; easy CI/CD use |
| BlazeMeter | Cloud auto-scaling, JMeter compatibility, visual scripting | ★★★★, zero infra; global load generation | 💰 Paid (usage-based cloud) | 👥 Teams needing managed, large-scale tests | ✨ Managed scaling + JMeter reuse; 🏆 easy onboarding for non-infra teams |
| WebLOAD | IDE + cloud modes, browser recording, JS-like scripting | ★★★★, strong recorder; IDE-centric workflow | 💰 Premium enterprise pricing | 👥 Enterprises with complex web apps | ✨ Accurate browser recording & transaction drill-down |
| Taurus | Unified YAML abstraction for JMeter/Gatling/Locust/Selenium | ★★★, simplifies orchestration; adds an abstraction layer | 💰 Free, open-source | 👥 Organizations standardizing across tools | ✨ Engine-agnostic YAML; run multiple engines from one config |
Turn the Shortlist Into a Responsible Test Plan
Tool choice gets easier when you start from the workflow, not the brand. Choose Apache JMeter when you need broad protocol coverage and no license cost. Pick Gatling or K6 when the team wants code-first tests that fit naturally into CI/CD. Use Locust or Artillery when the engineering culture is strongly Python or Node.js and the target is mostly HTTP or API traffic. Reach for LoadRunner, Neoload, or WebLOAD when enterprise diagnostics, recording, or broader protocol realities matter more than minimalist tooling. BlazeMeter fits managed distributed execution. Taurus matters when multiple engines already exist and you need one operational layer across them.
The more important decision is how you run the test. Start by defining the legitimate objective. Validate checkout stability, regional ad delivery, account signup resilience, API burst handling, or another concrete business path. Don't start with “see how much traffic it can take.” That usually creates noisy data and no useful decision.
Use staging whenever possible, or use approved production windows with clear ownership and rollback plans. Establish a baseline first, then set pass and fail thresholds for latency, errors, and throughput. Decide which regions matter. A geo-sensitive campaign, a localized pricing flow, or a country-specific compliance journey may justify region-based testing. A generic internal API usually won't.
Proxies belong only in the parts of the plan where origin identity changes system behavior. Datacenter IPs are fine for many backend load runs and are usually the simplest option. Residential IPs are useful when you need consumer-looking origins. Mobile proxies solve a narrower problem. They're relevant when you need to validate mobile-network-dependent experiences, carrier-sensitive behavior, or regional identity patterns that differ from fixed broadband.
That distinction matters because mobile 4G and 5G IPs are harder to block with simple IP rules. Carriers place many subscribers behind carrier-grade NAT, so one mobile IP can represent large numbers of real users, which makes blunt IP-based blocking risky and pushes systems toward behavioral detection instead, as explained in this overview of carrier-grade NAT and mobile proxy ranges. If your app behaves differently for mobile-origin traffic, that's a valid QA variable. If it doesn't, adding mobile IPs can just complicate analysis.
The same goes for protocol and session choices. HTTP(S) proxies are usually enough for standard web traffic. SOCKS5 is more flexible when you need a broader transport proxy model, and services often offer both together, as described in this proxy protocol overview. Then decide whether you need rotation or continuity. Rotating sessions change IPs frequently and suit high-volume collection or broad sampling. Sticky sessions keep the same exit IP for a defined period, which is better for login-based flows, account state, and any journey that depends on session continuity, as outlined in this guide to rotating and sticky sessions.
Monitor application behavior and proxy effects separately. That means tracking response times, throughput, and errors from the load tool while also watching whether the proxy path adds latency, changes headers, or alters geo resolution. Document consent, approved usage windows, and Terms-of-Service constraints before any test that touches third-party platforms or public properties. Responsible automation always has a business purpose and explicit guardrails.
If your team needs geo-dependent QA, regional campaign validation, market research, or other compliant origin-sensitive workflows, Evoproxy is one option to evaluate alongside the load testing tools themselves. The right stack is usually a combination: one tool for generating load, one monitoring layer for diagnosis, and one proxy approach only where geography or network identity belongs in the test.
If you need French mobile IPs for geo-dependent QA, campaign validation, market research, or multi-account workflow testing, Evoproxy offers mobile 4G connectivity built for those origin-sensitive scenarios. It's worth evaluating when your test plan depends on real mobile-network identity rather than generic datacenter traffic. Visit Evoproxy to see whether its mobile 4G proxies fit your specific workflow.


