
You're looking at a campaign dashboard that says everything is fine. Spend is pacing, conversions are climbing, and the platform is recommending more budget. Then finance compares those conversions with the CRM, and the numbers don't reconcile. The campaign didn't suddenly fail. The measurement system was never telling the whole truth.
Campaign performance tracking works only when it's treated as measurement engineering. Ad servers, tags, pixels, analytics systems, dashboards, CRM records, and server logs can each introduce a different error. The practical job isn't to admire a clean report. It's to prove that the reported outcome represents a real business event, then optimize against evidence that survives reconciliation.
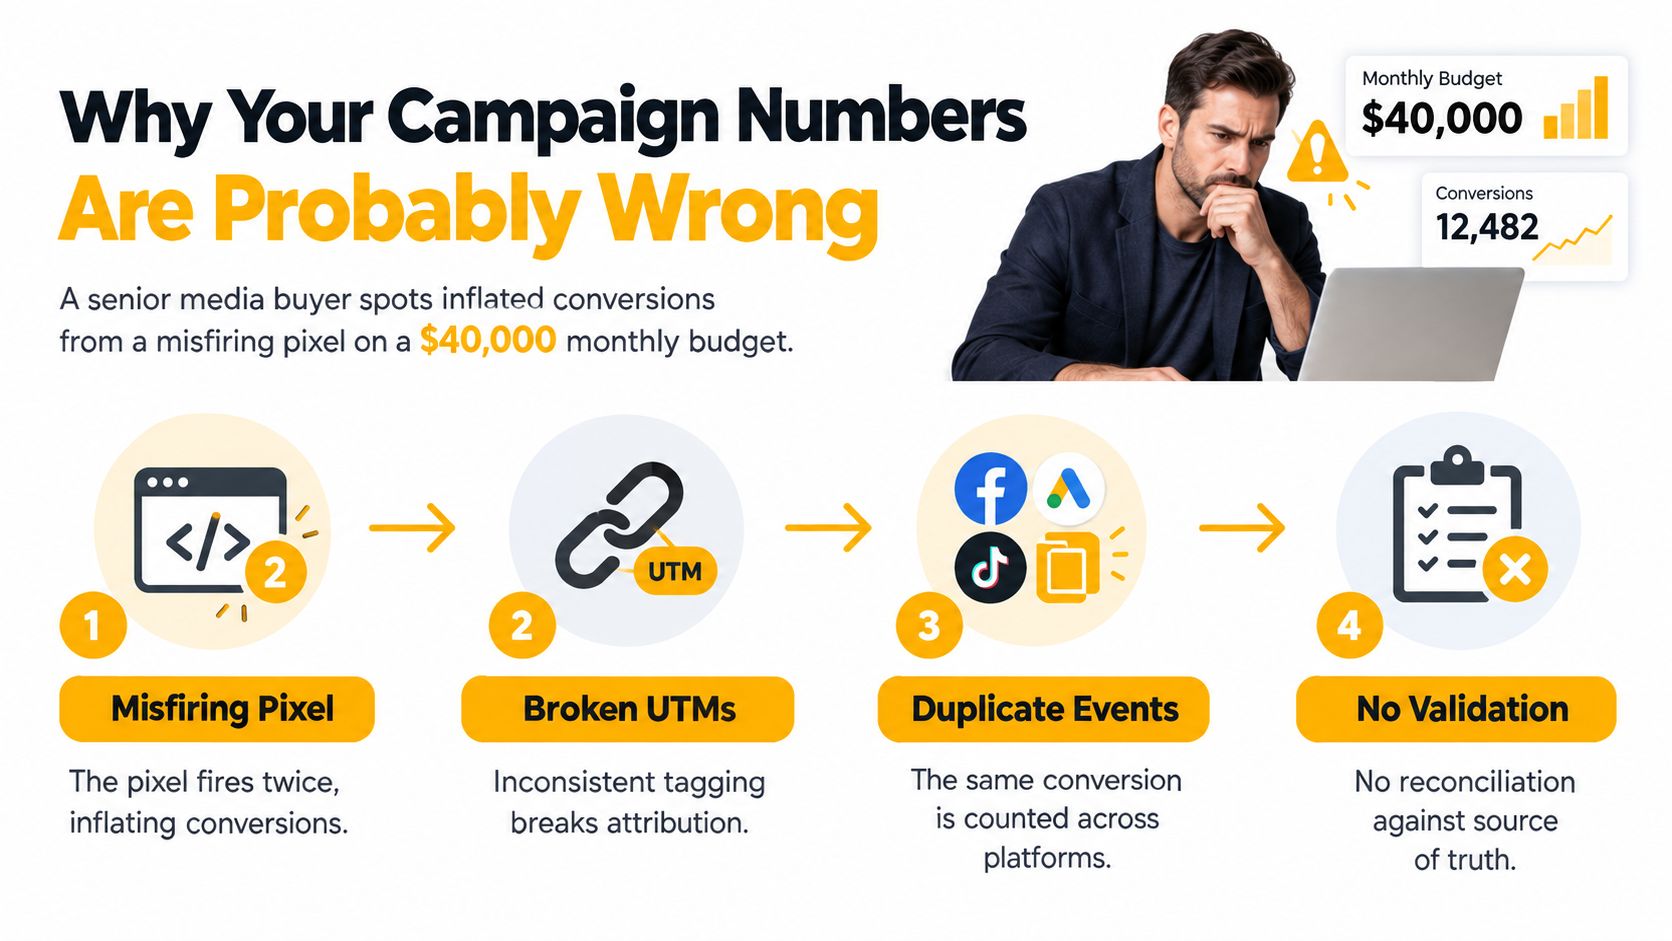
Why Your Campaign Numbers Are Probably Wrong
A senior media buyer once reviewed a campaign carrying a $40,000 monthly budget and noticed something that didn't fit. The platform reported a healthy stream of purchases, but the backend order system showed fewer completed orders. The discrepancy traced back to a pixel that fired twice when visitors refreshed the confirmation page. The account had been optimizing toward duplicated conversions for weeks.
The slide in the budget meeting showed the symptom, not the failure. Four common problems can create that symptom:
- Broken deduplication: Browser and server events need a shared
event_id. Without a consistent key, one purchase can become two conversions. - Last-click blindness: Last-click attribution assigns credit to the final recorded interaction, which can hide assisted revenue from earlier search, social, affiliate, or content exposure.
- View-through inflation: A broad view-through window can claim conversions after an impression even when the impression had little causal influence.
- Conversion API gaps: Browser-only tracking loses signal when users restrict cookies, browsers limit identifiers, or app privacy changes interrupt event delivery. Server-side methods can restore part of the workflow, but only when event schemas and identifiers match.
The measurement chain must be tested
Google Ads treats clicks and impressions as core campaign statistics and lets advertisers review customizable statistics tables from the Campaigns view. That reflects a broader shift from basic traffic counts to event-level reporting, where systems can connect exposures, clicks, page visits, online purchases, and offline purchases in one workflow through Google's campaign statistics guidance.
That connectivity is useful, but it also creates more points of failure. A redirect can strip UTMs. A tag can fire on the wrong page. A browser event can arrive while its server counterpart fails. A dashboard can combine different attribution windows and present the result as if it were comparable.
Practical rule: Never optimize a campaign from a platform conversion total until you've compared it with an independent source of truth.
For teams managing social accounts, ad verification, market research, or compliant data collection, the same discipline applies to every campaign path. A geo-dependent landing page, redirect, or pixel should be checked as deliberately as the conversion itself. The Facebook data collection workflow is one useful reference for thinking about that path as a sequence of testable requests rather than a single dashboard event.
The workflow that catches these errors starts before launch. Define the event, document the expected parameters, test browser and server delivery, reconcile conversions, and validate the user experience by market. A wrong number on a slide is embarrassing. A wrong optimization signal is expensive because it keeps directing spend toward the defect.
Defining KPIs That Match Each Channel
A KPI is useful only when it helps someone make a decision. Impressions can describe exposure, but they don't prove attention. Click-through rate can reveal creative response, but it doesn't prove qualified demand. Revenue metrics matter, yet they can mislead when attribution rules, approval status, or customer quality aren't controlled.
Start by assigning metrics to the stage you're trying to influence:
- Awareness: Impressions, reach, CPM, and video completion rate describe delivery and attention.
- Engagement: CTR, dwell time, share rate, and cost per engaged session indicate whether the audience responded meaningfully.
- Conversion: CPA, ROAS, conversion rate, and lead quality score connect activity to commercial outcomes.
- Retention: LTV, repeat purchase rate, and subscription renewal reveal whether acquisition produced durable value.
Map the metric to the buying mechanism
PPC needs delivery and auction context, so impression share, quality score, and CPA belong together. Social needs a stronger creative signal, which makes thumb-stop ratio and save rate more useful than reach alone. Affiliate reporting requires commercial validation, including EPC, conversion approval rate, and the share of new customers generated.
| Funnel stage | Social KPI example | Affiliate KPI example | PPC KPI example |
|---|---|---|---|
| Awareness | Reach and video completion rate | Approved exposure or placement delivery | Impressions and impression share |
| Engagement | Thumb-stop ratio and save rate | Click quality and engaged sessions | CTR and quality score |
| Conversion | CPA and landing-page view-through rate | EPC and conversion approval rate | CPA and conversion rate |
| Retention | Repeat purchase rate | Incremental new-customer share | LTV by source |
Use the table as a starting map, not a universal scorecard. A social campaign optimized for qualified leads should improve lead quality above cheap form submissions. An affiliate campaign promoting a subscription should separate approved conversions from raw tracked conversions. A PPC campaign with limited branded demand may need impression share as a constraint, but CPA remains the commercial decision metric.
A dashboard metric earns its place when a channel owner can explain what action follows a change.
Set the analytics window before launch. A KPI that can't be measured consistently within the selected attribution and reporting window will create false comparisons. Revenue, margin, lead quality, and customer status should come from systems that reflect the business outcome, not only the ad platform.
Give every campaign three metrics: one primary KPI, one secondary KPI, and one guardrail metric. The primary KPI controls the main optimization decision. The secondary KPI explains movement. The guardrail triggers a pause when quality, compliance, frequency, margin, or customer value deteriorates. For service teams and campaign operators, responsive customer service practices also matter when a sudden performance shift reflects customer friction rather than media quality.
Tagging, Pixels, and Conversion Events Done Right
Most tracking failures begin with naming, not code. A campaign can have a correctly installed pixel and still produce unusable reporting if one team writes Paid_Social, another writes paid-social, and a third leaves the source blank.
Use a documented UTM taxonomy:
utm_sourceidentifies the platform or partner.utm_mediumidentifies the channel type.utm_campaignidentifies the approved campaign name.utm_contentseparates creative, placement, or variant.utm_termrecords keyword or targeting detail where relevant.
Keep required fields lowercase and define the campaign naming pattern in one shared document. Dynamic insertion in Google Ads or Meta can populate useful values, but it can also introduce inconsistent separators, unexpected characters, or values that don't match the reporting taxonomy. Test the final landing URL, not just the template.
Build events with a single business definition
A purchase should mean the same thing in the browser, server, analytics, and CRM layers. For a tag manager implementation, the operating pattern should look like this:
- Fire the Meta browser event on the confirmed purchase state.
- Send the matching server event with the same
event_id. - Populate value, currency, order identifier, and product context.
- Confirm that the platform deduplicates the pair rather than counting both.
For Google Ads, configure the conversion tag around the actual business event and use enhanced conversions where appropriate. Hashed email can support matching when collected with proper consent and handled under the applicable privacy requirements. For TikTok, pair the browser pixel with Events API so server-side events can be validated against client-side delivery.
The server layer can use Meta CAPI, GA4 Measurement Protocol, or TikTok Events API. It isn't a magic repair tool. If the server event lacks a stable identifier, carries the wrong value, or fires for a different event definition, it creates a second source of confusion.

Run a preflight before spend starts
Use a test order or lead and verify each item:
- Page state: The tag fires on the true confirmation state, not every page load.
- Deduplication: Client and server events share the same key.
- Event count: One business action produces one counted conversion.
- Commerce fields: Value and currency are present and correctly formatted.
- Platform receipt: The test event appears in the relevant event manager within the expected processing window.
- Backend match: The order or lead exists in the CRM or source system.
Run endpoint checks before launch, especially when redirects, geo rules, or consent states change the final request. The API endpoint testing guide provides a practical way to treat event delivery as an observable system rather than an assumption.
Picking Analytics, Attribution and Tagging Stacks
A campaign can look profitable in one report and unprofitable in another. Stack selection should therefore follow the decisions the team must make, not the length of a feature list. Use a web analytics layer for behavior, an attribution layer for cross-channel credit questions, and a tagging approach that keeps event delivery observable while respecting privacy and consent.
A general analytics platform fits traffic, acquisition, and conversion reporting. A privacy-focused option suits teams that prioritize data residency and first-party ownership. A product analytics layer fits teams studying user journeys, feature adoption, or cohort behavior rather than campaign outcomes alone.
Attribution suites help reconcile paid social, search, affiliate, CRM, and offline outcomes in one operating process. They do not repair inconsistent event definitions. They expose those inconsistencies, which can make reporting look worse before the underlying measurement improves.
Match attribution to the question
Last-click asks which interaction came immediately before conversion. Position-based attribution assigns more credit to selected points in the journey. Data-driven attribution estimates contribution from observed paths. None of these models proves causality independently.
A conversion-lift method addresses that limitation by dividing exposed users into treatment and holdout control groups, then comparing conversions across the full study period. It sets ordinary attribution rules aside and reports incremental conversions and relative lift. That makes it useful for testing whether spend created additional outcomes. The conversion-lift methodology overview explains why reported conversions should not be treated as equivalent to causal lift.
Large advertisers increasingly combine measurement methods. A 2025 summary from a major technology platform and a consulting firm reported that 81% of organizations run attribution, 79% run marketing mix modeling, and 86% run incrementality testing. The marketing attribution statistics reference supports a practical conclusion: mature measurement uses several methods because each answers a different question.
A simple stack decision matrix
| Team profile | Primary analytics | Attribution layer | Tagging approach |
|---|---|---|---|
| Small single-property team | Standard web analytics | Consistent last-click with CRM checks | Browser tags with server support for key events |
| Growing multichannel team | Web analytics plus product or lead analysis | Position-based or blended channel reporting | Managed server-side tagging |
| Enterprise or agency team | Central warehouse and governed analytics | Attribution plus MMM and incrementality | Server-side collection with documented schemas |
| Privacy-sensitive team | First-party or self-hosted analytics | Incrementality and modeled measurement | Consent-aware server-side implementation |
A CDP earns its cost when multiple properties, identifiers, and destinations require consistent schemas. For one site with a narrow channel mix, it can add governance work without improving decisions. Server-side tagging can reduce signal loss caused by browser restrictions, ad blockers, and cookie limitations. It also moves responsibility toward consent management, logging, access control, and event QA.
Keep dashboards directional until the measurement plumbing has passed validation. Independent 2026 research reported that 65.7% of marketers cite data integration as the main measurement barrier, 41% struggle to track customer touchpoints, and only 29% report high confidence in attribution accuracy. The findings are summarized in independent attribution research, supporting a cautious operating posture. Validate reported outcomes against backend records, stable event definitions, and controlled tests before changing budgets.
Building Dashboards That Survive Daily Use
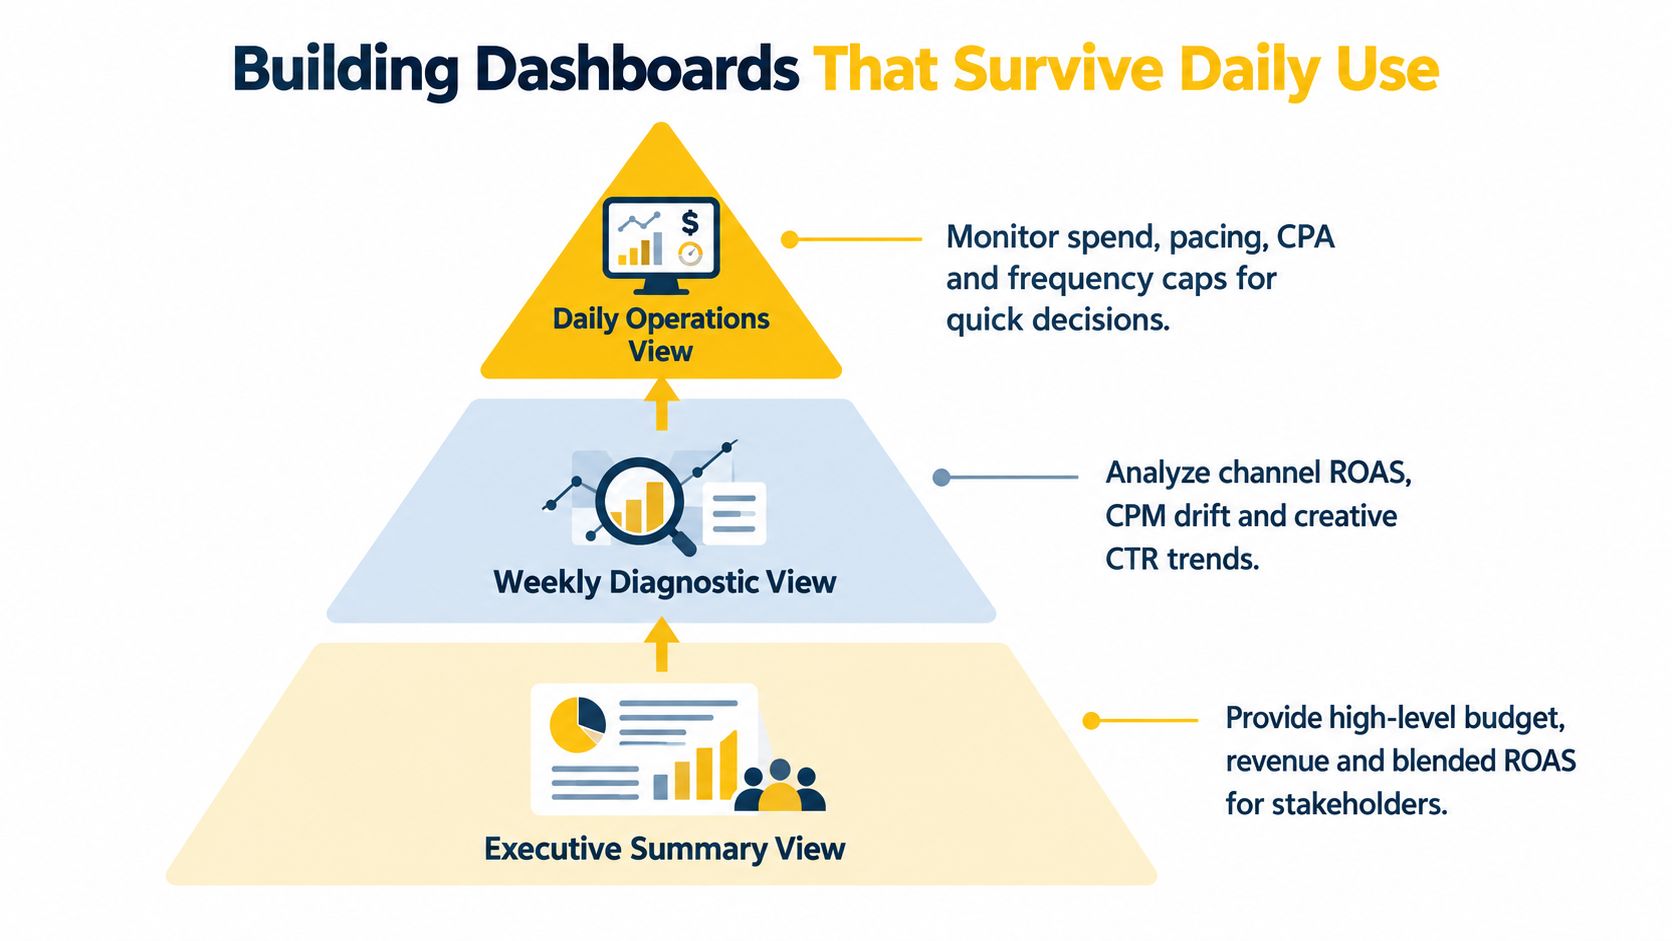
A dashboard earns trust by supporting a decision before its deadline. The daily operator needs to know whether delivery is controlled. The weekly analyst needs to isolate why performance changed. An executive needs to see whether investment is producing profitable growth, not resting on attributed credit alone.
Build three views with different jobs instead of forcing every audience into one report.
The daily operations view
Show spend, pacing, CPA, conversion volume, budget utilization, frequency pressure, delivery status, and tracking-health signals. Compare each metric with the approved plan. Give campaigns explicit states such as learning, limited, rejected, or under review, so operators can act without interpreting ambiguous colors.
Put validated outcomes and spend control above raw impressions or reported reach. Reach can help diagnose delivery, but it is a weak basis for budget decisions when identity resolution and deduplication remain uncertain.
The weekly diagnostic view should expose channel-level ROAS, CPM movement, creative CTR, conversion rate, landing-page performance, and audience or segment results. Keep browser, server, and backend counts separate. A blended total can hide a broken event stream until the budget has already shifted.
The monthly executive view
Include budget, revenue, blended ROAS, margin context, LTV by source, and an incrementality proxy. Label reported revenue, reconciled revenue, attributed revenue, and incremental revenue as separate measures. Without those labels, modeled attribution can be mistaken for confirmed business impact.
Choose the reporting layer according to the team's operating needs. Lightweight business-intelligence tools suit simple reporting. Observability systems fit technical teams that need logs, uptime checks, and event monitoring. Agency-style reporting systems suit repeated client deliverables. The category matters less than stable definitions, refresh monitoring, access control, and a named owner for every metric.
Configure alerts around operational risk. A 20 percent spend deviation in 24 hours or a 15 percent CPA jump should create an investigation task, with thresholds stored as explicit rules. Send the alert through the team's notification channel or email, include the affected account and date range, and link to the diagnostic view. Add a suppression rule for known launch or budget-change windows, otherwise alert volume will train operators to ignore real failures.
A dashboard should tell the operator what changed, what might have caused it, and what action is safe to take next.
Validating Data with QA and Geo Tests
A campaign can look healthy in the ad account while the CRM shows fewer qualified leads and the order system records less revenue. Reconcile those layers every week with the same date range, timezone, conversion definition, and reporting window. Treat the gap as a measurement defect to investigate, not as a reporting detail to explain away.
Platform totals can diverge materially from backend records when integrations, deduplication, or attribution rules differ. Keep the reconciliation sheet simple:
- Platform layer: Report conversions, spend, clicks, and impressions.
- Analytics layer: Confirm sessions, events, source, medium, and campaign.
- Server layer: Check received events, response status, timestamps, and identifiers.
- CRM or order layer: Confirm qualified leads, approved orders, closed revenue, and refunds.
Record the reason for each variance, such as delayed server events, duplicate browser fires, timezone mismatches, refunds, or rejected leads. Assign an owner and a resolution status. A weekly comparison without an audit trail becomes a recurring meeting, not quality assurance.
Test the experience by market
Aggregate reporting can hide a broken journey in one country or device group. Use compliant residential or mobile proxies to test target markets, then inspect the landing page, redirect chain, consent state, currency, product availability, pixels, and conversion path from the visitor's perspective.
Residential proxies map to consumer networks, while mobile proxies use carrier networks such as 4G or 5G. Datacenter proxies come from hosting networks and are often easier to identify. Mobile and residential addresses may be harder to block because they resemble ordinary consumer or carrier traffic, but they still produce signals. Request velocity, device and IP fingerprint mismatch, and IP reputation affect test validity, as explained in proxy IP range guidance.
Use sticky sessions when one test must preserve the same visitor identity throughout a journey. Rotating proxies change the IP per request or session. Sticky sessions preserve one IP for a defined period, with session ID and duration controls supporting continuity, as described in session management documentation.
Check for false affiliate outcomes
Affiliate traffic requires a separate fraud check. Reverse-IP lookups can expose repeated network patterns, user-agent audits can identify automated clients, and time-to-conversion histograms can reveal clusters unlike normal customer behavior. Compare these findings with CRM approval rates, refunds, and downstream revenue before increasing partner budgets.
Finish with geo holdouts or public service announcement tests. A treatment region receives the campaign while a comparable control region does not. Compare outcomes using the same reconciliation rules, then assess whether the difference persists after accounting for baseline demand and delayed conversions. Incrementality testing is the final defense against treating correlation as causation.
Running an Optimization Workflow That Sticks
A durable workflow gives every day a job and every decision an artifact. Monday is for data QA and anomaly flagging. Reconcile the platform, analytics, server, and CRM layers before moving budget. Tuesday is for reallocating budget between social, affiliate, and PPC using validated CPA and ROAS, not unverified platform totals.
Wednesday is the creative checkpoint. Refresh assets when CTR falls below the threshold set in the campaign plan, but inspect frequency, audience composition, landing-page speed, and tracking health before blaming the creative. Thursday is for bid and audience changes informed by the attribution review. Friday closes the loop with a dashboard snapshot and stakeholder summary.
| Cadence | Tasks | Owner | Key inputs | Output |
|---|---|---|---|---|
| Weekly | QA, anomaly review, budget changes, creative checks | Media and analytics owners | Reconciled CPA, ROAS, delivery, CRM quality | One-page weekly scorecard |
| Monthly | Incrementality read, attribution audit, UTM and pixel sweep | Measurement lead and channel owners | Test results, event logs, source taxonomy | Monthly experiment log |
| Monthly | Planning and stakeholder review | Marketing lead | Scorecard trends, margin, LTV, channel notes | Next-cycle test plan |
The monthly routine should include an incrementality read, attribution audit, pixel and UTM hygiene sweep, and planning pass. Keep a standing 30-minute review with channel owners. The meeting should end with named decisions, owners, deadlines, and one sentence explaining why each budget or setup change was approved.
The operating documents matter. The weekly scorecard preserves the decision record. The monthly experiment log prevents teams from repeating inconclusive tests. The review creates accountability between media, analytics, creative, engineering, and CRM owners.
Geo verification feeds the entire cadence because a campaign can report healthy numbers while showing the wrong page, redirect, price, or consent experience in a target market. Mobile proxy networks are useful for that controlled validation when the test is authorized, rate-limited, and designed around real user journeys. Enterprise proxy setups may support HTTP(S) and SOCKS5, with targeting by country, state, city, ZIP, or ASN, where ASN targeting helps test delivery through a specific ISP or carrier network, as documented in residential proxy technical guidance.
Evoproxy provides mobile 4G, LTE, and 3G connectivity with personal and shared ports, configurable rotation, and geo validation use cases. If you need to verify region-specific landing pages, ad redirects, or conversion paths, visit Evoproxy and choose a mobile proxy setup that matches your authorized testing workflow.


